Optical Power meters for fiber optic use can be usefully characterized by the type of optical detector used. The following general discussion assumes that fiber optic systems or test sources being measured, have an actual wavelength uncertainty of e.g. ±30 nm, which is a specification of typical fiber optic transceivers and many test sources.
There are a few broad classes of optical power meter detector heads for fiber optic use:
- Small detector, fixed optical connector (low cost)
- Large area detector, typically 2 - 10 mm, usually with interchangeable connector
- Lensed detector, usually with interchangeable connector
- Lensed detector with tiny detector & 270 Hz optical chopper, offering extended sensitivity. Laboratory use, often fixed connector.
InGaAs (Indium Gallium Arsenide)
Typical InGaAs detectors provide excellent accuracy from 1000 to 1650 nm, however only modest accuracy around 850 nm, due to wavelength sensitivity. So, they are preferred detectors for typical single mode systems.
A class of visible-enhanced InGaAs detectors provides good accuracy for 850 - 1625 nm systems, so it is suitable for a wider variety of multimode / single mode/ WDM glass fiber optic systems.
Large-Area InGaAs detectors are very expensive, so are typically limited to laboratory applications.
Ge (Germanium)
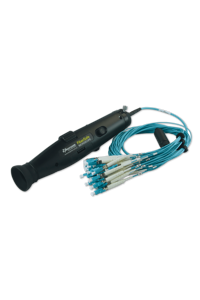
Ge detectors are commonly used where large detectors are required, due to the very high cost of large InGaAs detectors. For example, on-site measuring of multi-fiber / MPO connectors.
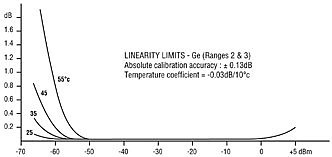
Ge detectors provide modest accuracy over the 850, 1310 & 1550 nm bands, but above exactly 1550 nm their absolute accuracy becomes poor and is heavily affected by cooler climatic temperatures likely to be experienced in practical field applications. A number of other technical limitations means that they are best used in low-precision (field) or relative (e.g. dB testing) applications.
Ge detectors have the highest saturation power of the detector types discussed here, so can be useful for high power measurements.
Si (Silicon)
Si detectors are inexpensive and provide excellent accuracy at 850 nm and visible wavelengths. They are therefore used on 850 nm multimode / PCS systems, 660 nm POF systems, and 850 nm multi-fiber multimode systems (e.g. MPO)
However, note that many cable test standards also require loss testing at 1300 / 1310 nm on multimode systems, in which case a silicon detector is not adequate.
High power
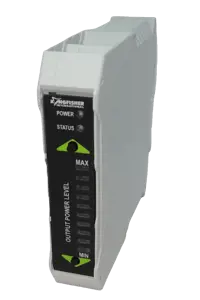
"High Power" for optical power meters can be anything above about 0 dBm, depending on the equipment. High Power detectors usually have an attenuating filter placed in front of the detector, specialised detector electronics, or both. Various types of attenuator elements have varying levels of wavelength sensitivity, coherence sensitivity, polarization sensitivity and reflection levels, all of which can badly affect meter accuracy. Kingfisher attenuated meters use a multi-technology attenuator to provide the best possible blend of characteristics for fiber optic applications.
Attenuated detectors invariably have lower accuracy, so should only be specified where needed.
Alternatively, the best way to attenuate high power measurements in a laboratory, is to use an integrating sphere, which provides high accuracy.
Response mechanism
Semiconductor optical detectors convert one photon of light energy into one electron of electrical current, with an efficiency that is wavelength dependent. Fig 9.1 shows the measured relative response curves for four types of detectors. Most response curves available on the web, are quite inaccurate.
The energy in each light photon is determined only by the light wavelength and must be at least as big as the electron band gap of the detector material. At the wavelength where the photon energy exactly matches the band gap energy, peak responsivity is achieved. If the energy is too low, no current flows. If there is excess energy (e.g. shorter wavelengths), then the excess energy is lost as heat.
The detector response to wavelengths longer than the peak efficiency is very temperature sensitive. So, for precision work, it is not advisable to use a detector in the "tail" region.
An important part of these detectors is an anti-reflection coating on the detector surface, without which the detector material would reflect most of the light before it ever reached the active region. The performance of this anti-reflective coating critically affects overall performance.
The detector package window should be made of optically flat glass with an anti-reflective coating, to avoid Fabry-Perot resonances. Many cheaper detectors fail in this area.
The performance of both the package window and anti-reflective coatings can significantly affect overall detector performance.
The responsivity or calibration of a particular detector at a particular wavelength is usually defined in terms of Amps per Watt, or A/W.
Calibration
Correct calibration is important when measuring absolute power levels such as transmitter output and receiver input power. Attenuation measurements are always relative power readings, in which case only linearity and repeatability are important.
Calibration significantly affects absolute accuracy. A power meter semiconductor detector requires calibration close to the wavelength at which it will be used, and the calibration should be properly traceable to a national standard. ‘Calibration uncertainty’ refers to the uncertainly under ideal conditions, e.g. with a particular fiber and connector type, wavelength, power level, and at a laboratory temperature.
An electrical multimeter typically quotes ‘basic accuracy’, which includes all calibration, linearity, ageing and temperature effects, and so gives a good idea of what a meter will achieve in real use. However, with optical power meters, quoted "accuracy" is often just "calibration uncertainty", so it gives no clue as to expected performance under real conditions. This is a hang-over from the days when these were laboratory scientific instruments for use by physicists, but it is most unhelpful to typical fiber optic users.
So to find the accuracy of an optical power meter reading in field conditions, you may need to assess the effects of changing fiber types, connectors, power levels, wavelengths (e.g. within a band) and temperature, and if any additional "zeroing" procedures are required to achieve this performance. It is often hard to do this assessment since specifications are left deliberately vague.
Kingfisher quotes a "Total Uncertainty" specification for power meters, which is equivalent to a "basic accuracy" specification since it includes all of these effects.
Re-calibration
Most national standards authorities suggest a standard re-calibration period for electronic instruments of 1 year. However, most meter specifications are so imprecise compared to their electronic systems, that this is generally excessive, and anyway calibration does not adjust linearity or other offsets that users might find worrying. The almost universal reason we find for meters going out of calibration during use is dirt or physical detector damage, since the optical detector is relatively delicate and easily damaged.
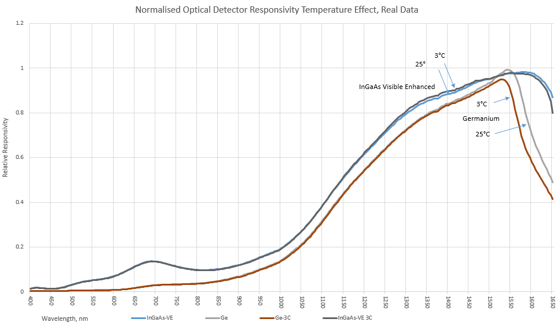
Fig 9.2: Measured effect of temperature on spectral response for Ge and InGaAs detectors.
However, users might still be advised to perform a low-cost verification check perhaps more than once a year, due to the simple question: what is the cost and likelihood of an inaccurate instrument? This suggests that the shrewd user could usefully implement a process of inexpensive regular checks, followed by occasional formal re-calibration.
Typical instrument limitations
Calibration accuracy can be upset by changing connector type or optical connector ferrule materials. On some types of instruments, we have observed errors of 1 dB due to this effect. It is not easy for the typical user to analyze this rather worrying issue. We can say that kingfisher meters are designed to minimize this effect, with errors typically within 0.02 dB.
Instrument effective dynamic range depends on a collection of factors including detector choice, optical design & electronic design.
At high power levels, localized detector saturation can occur, which makes the measurement increasingly non-linear. The level at which this happens also depends partially on the beam profile or geometry, and partially on the instrument electronic design. Therefore, saturation effects can vary on a case by case basis, typically somewhere above 0 dBm. Many instrument specifications tend to be vague, hopeful, or optimistic on the saturation effect. Look very carefully at instrument accuracy specifications at required measurement levels above 0 dBm. If in doubt, check with a precision attenuator placed before the meter.
At low power levels, detector amplifier drift dominates, and the detected power can become highly non-linear. This effect can be highly temperature sensitive, to an extent where accuracy is only guaranteed within ± 1O°C from " zero " compensation: not much use on a field instrument! Many instruments require the user to apply "zero" compensation to meet accuracy specifications. This is often not done, or done incorrectly, thus making measurements suspect. The whole subject of "zeroing" is avoided by many suppliers, who only refer to it half-way through the operating manual. When specifying an instrument, be very careful when interpreting specifications.
In relation to the dynamic range of an instrument, look for the achieved accuracy over the stated range. It is very easy to make an instrument display a number over a wide dynamic range, but quite another to achieve a specified accuracy over the same dynamic range. Kingfisher instruments are fully specified over their entire dynamic range.
Wavelength sensitivity needs to be checked for your application. For example, an InGaAs sensor may have a specified accuracy of ± 0.2 dB at 850 nm, however measuring over the 850 nm band, e.g. ± 30 nm, the achievable accuracy may be no better than ± 1.2 dB. In contrast, for WDM applications from 1480 - 1625 nm, an InGaAs sensor delivers good accuracy even if it is only calibrated at 1550 nm. The typical error with an InGaAs instrument set for 1550 nm, but used at 1625 nm, is only about 0.3 dB.
Germanium has several specific weaknesses, which limit its application to low precision work:
- Linearity is about ± 0.04 dB across the measuring range.
- Surface uniformity is relatively poor at ± 0.09 dB. e.g. if a light spot is moved across the detector surface, the reading will vary by this much.
- Calibration drifts over temperature, e.g. at 1300 nm it drifts typically about 0.1%/°C, or ± 0.1 dB over 0 - 50°C.
- Limited sensitivity.
Because of these combined effects, in the 1300 and 1550 nm bands, InGaAs provides markedly better measurement accuracy than Ge, even if the instrument specifications do not show it very clearly.
How much measurement resolution do I need?
Measurement instruments are available with resolutions of 0.1 - 0.001 dB of resolution. It is possible to make use of 0.001 dB resolution in carefully controlled laboratory conditions, but there is very little use for such resolution in general applications.
0.1 dB resolution has a major drawback: it cannot be used to reliably measure the performance of high quality connectors or splices, since the measurement uncertainty involved is in excess of ± 0.14 dB ( e.g. ± 1 digit, over 2 measurements ). This is purely due to display limitations and assumes otherwise perfect performance.
It therefore becomes apparent that 0.01 dB (0.23%) resolution is ideal for most work. It is for this reason that Kingfisher instruments generally provide a resolution of 0.01 dB.
Other instrument issues
Instrument battery life is obviously a major convenience issue. Kingfisher meters have a battery life of more than 170 hours. Also important is an auto-turn off feature, and low battery indicator. Where possible, alkaline batteries are preferable to re-chargeable types, due to greater operational convenience.
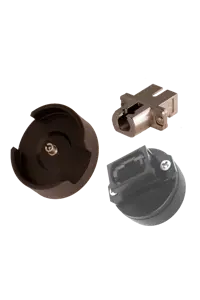
Connector: An interchangeable connector is obviously highly desirable, allowing the user to change connector styles. An interchangeable connector should also allow for detector cleaning during use.
Speed of response: Many meters seem to have an excessively slow response speed or spend their time auto-ranging. Always try this out when specifying new meters.
It is a great productivity feature to have a proper reference feature on a meter since attenuation measurements are related to a reference. The reference feature should allow a separate reference for each wavelength, and recall the previous reference when the unit is turned back on.
Ease of use: how long will it take to train operators? Kingfisher meters with similar general features and controls are available over the full spectrum of price and performance. A single method of operating all meters could save a large organization plenty on training costs.
It is handy if your meter can also perform some sort of tone identification. This is useful for continuity checking or locating breaks.
Simplicity of use is very important for a good level of measurement confidence.
It is handy if re-calibration can be performed without opening the instrument, and without adjusting potentiometers.
When examining a meter, check to see that it is reasonably easy to clean the input. Some instruments are seriously deficient in this area.
There is some confusion about the requirement to display power in both logarithmic (dB, dBm) and linear (mW, uW, nW, pW) units. Traditionally, multi-purpose meters for general scientific applications, can display either unit. However, in fiber optic applications, it is usual to use dB or dBm units.
There are a couple of ways of achieving productivity gains in multiple-wavelength measurement situations:
- An "Autotest" type of feature can display both wavelengths simultaneously. This requires the source and meter to communicate, and the meter measures each wavelength alternately. This requires both instruments to have compatible protocols.
- A different arrangement can be used where the source power levels can be adjusted. The meter is referenced to the source and the output power of one wavelength adjusted relative to the other, so that the meter reads 0 dB at both wavelengths, without changing meter wavelengths. Attenuation at both wavelengths can now be measured, without adjusting the meter.
More information