Introduction
This paper points out a common flaw in the industry standard method of calculating bi-directional attenuation in fibre communication systems. This flaw tends to exaggerate problems due to poor measurement technique, resulting in needless re-work. A simple remedy for this problem is to use a spreadsheet to perform the required calculations.
Current Practice
Optic communication systems are being installed at a massive rate, to cope with rapidly increasing data communications requirements worldwide. A critical part of verifying an installation, is measuring end to end attenuation. This measurement is important to ensure that the system will perform to specification. The effect of attenuation on a typical communications link can be illustrated as follows:
Maximum attenuation over which the system can operate (from transmission system specification sheets), say = 25 dB.
Maximum installed link attenuation with say 6dB margin to allow for route degradation over planned lifetime = 19 dB
In this example, the installed route attenuation is to be no more than 19 dB. To ensure this is achieved, an allowance for measurement uncertainty must be made, which is say 1.5 dB, so:
Maximum measured attenuation will be no more than 19 - 1.5 dB = 17.5 dB
The attenuation is commonly calculated by averaging a bi-directional measurement using a remote reference. There are various reasons given for this, but the most important practical reasons are that this method eliminates meter calibration errors and minimises the effects of source drift.
This paper does not attempt to analyse the various work practices surrounding this process, however it does analyse the outcome, because the simple maths involved contains a fundamental flaw, as follows:
| Attenuation measured in one direction: |
x |
| Attenuation measured in other direction: |
y |
| Average attenuation: |
(x + y) / 2 |
This is of course simple stuff however the hidden flaw is that it is mathematically incorrect for the logarithmic or dB units which are commonly used. The example in Table 1 using both linear and logarithmic methods to demonstrate this:
| |
Averaging using
dB units |
Averaging using
linear units |
| Loss in one direction |
0 dB |
0 % |
| Loss in other direction |
100 dB |
100 % |
| Average |
50 dB (47 dB error) |
50 % (correct 3 dB) |
The mathematically correct answer is 3 dB, which is given by the linear maths. In this example, the error caused by attempting to average logarithms is massive, 47 dB.
Why is it that the industry standard approach has not been corrected a long time ago? The easy answer is of course that the two numbers being averaged are normally fairly similar, so the discrepancy is smaller and easily missed. It is also much easier to do a simple mental calculation to average almost similar numbers. For example, the average of 3 dB and 3.2 dB is near enough 3.1 dB. Also, it is only recently that field technicians have routinely carried computers.
Problems resulting from the averaging error
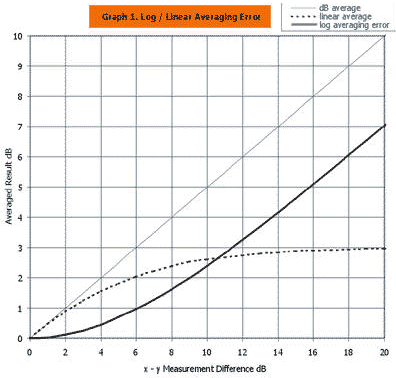
Under ideal measurement situations, the errors are indeed small enough to ignore. However, when measurements are less than ideal, the more lossy measurement term comes to dominate. In fact, this discrepancy leads to an interesting problem, where suddenly 'all measurements are suspect', and total re-work is demanded. The error is summarised in Graph 1, which shows that the maths error produces real world errors when the (x and y) measurement differences are above 2 dB.
Table 2 shows a 10-fibre cable, measured in each direction (at one wavelength) with a source and meter. For the sake of clarity of numbers, the loss is taken to be 0 dB, so the numbers in the table represent extra losses due to poor measurement practice:
| Fibre No. |
Measured loss A >B, dB |
Measured loss B >A, dB |
Incorrect Log Average |
Correct Linear Average |
| 1 |
1.00 |
1.50 |
1.25 |
1.24 |
| 2 |
0.60 |
1.00 |
0.80 |
0.80 |
| 3 |
1.50 |
0.80 |
1.15 |
1.14 |
| 4 |
2.00 |
0.40 |
1.20 |
1.14 |
| 5 |
0.40 |
2.10 |
1.25 |
1.16 |
| 6 |
0.80 |
3.00 |
1.90 |
1.76 |
| 7 |
1.80 |
1.00 |
1.40 |
1.38 |
| 8 |
2.00 |
0.80 |
1.40 |
1.36 |
| 9 |
1.00 |
0.50 |
0.75 |
0.74 |
| 10 |
3.00 |
1.00 |
2.00 |
1.89 |
| Mean |
|
|
1.31 |
1.26 |
| Std Dev |
|
|
0.40 |
0.36 |
In this example, the error caused by the log method is small but observable, with the 95 % confidence limit shifted by about 0.1 dB. This agrees with the previous statement that the maths error becomes an issue when the measurement discrepancies are of the order of 2 dB (in this case the average is 1.26 dB).
Effects of using Different Instrument Types
This error is somewhat affected by different sorts of instruments and working methods. In practical terms, the math error is most relevant if two separate tests are averaged.
For example, if a simple source and meter are used to perform a bi-directional loss analysis, effectively 2 independent tests are set up and performed, and the math error will be present.
If a bi-directional instrument is used, effectively there would be no math error due to multiple connector insertions since the measurement is only set up once. However, the instrument would still need to use the correct maths internally. This is easily checked by examining, for example, an optical isolator, which should average to only a few dB loss. Also, in this case, random bad connection errors are 100% shown in the results, so more care is needed to ensure there are no bad connections.
Discussion
The practical effect of the maths error has been verified in conversations with senior field staff, who readily confirmed that re-work had been requested, where they were confident there was no actual problem. Having discussed the error, they agreed that the corrected math would have resulted in fewer problems.
The effects of these delays on network specification, repair times and system rollout schedules are real. The solution is now very simple: average the measurements using a spreadsheet, which incorporates the correct linear maths. The use of a PC is now very common for recording results.
Not discussed in this paper is the effect of incorrect maths on the statistical results of data logging, both would be affected. In addition, no attempt has been made to survey industry standard practices in other fields such as losses in electrical and radio systems.
Conclusion
A maths problem affecting the practical accuracy of end-to-end attenuation measurements has been identified and demonstrated. The result of this problem is needless re-work and delay in system acceptance and repairs. Due to the now common use of PC computers, this is easily fixed by use of a spreadsheet set up with the correct linear maths.
A free KITS™ spreadsheet with correct maths and suitable for loss reporting is available for download here: KITS™ Reporting Software.
More Information
You may print, photocopy, and redistribute this document for educational use only, provided that this page is printed as is, without modification. This page may not be used commercially.
This example demonstrates that Graph 1 could be used to estimate the errors achieved in any situation.


